
This post briefly explains how to bind Visio diagram, exported as HTML to some external live web-service.
It’s based on the HTML/SVG export extension.
If you want the exported diagram to be connected to some live data, you’ll need to connect to some live service (in this example, we consider a REST service). In the following posts, I’ll discuss binding a diagram to a SharePoint list using JSOM / REST.
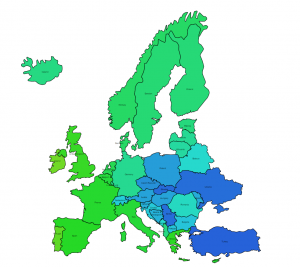
So, let’s take map of Europe and show temperature by coloring countries, with colder colors indicating colder temperature! You can check the result in DEMO section (click the picture to navigate):
Here is basically the sequence of steps how to build it:
- Grab a Visio diagram, showing a Europe map. There are many (well, at least some) available. You could take, like me, simply an SVG file from Wikipedia, or you can check out the map from VisGuy, or just take stock Microsoft maps.
- Add extra information for the diagram you want (in our case, I’ve added capital names as shape data). The reason to go for capitals, we need some particular point to get weather for. Capital looks like one that fits.
- Write a bit of javascript to get data from the open source weather service and update the shapes. We’ll be using openweathermap.org API, basically because it’s free until you do mass queries. Updating is quite easy – we won’t be even using d3, everything done with plain jquery.
The sample diagram and the data (capitals list) can be downloaded here:
| File | Description | Size | Date |
|---|---|---|---|
| EuropeWeather.zip | Sample diagram, demonstrating binding html-export to a live weather service. The package also includes Excel data (countries, capitals, coordinates) | 697.9 KiB | 30.01.2017 |
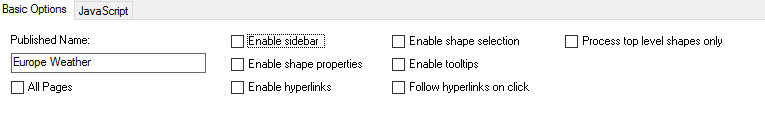
As a first step, let’s turn off (uncheck) all basic services, so that they are not in the way. I’ve described those in the previous post.
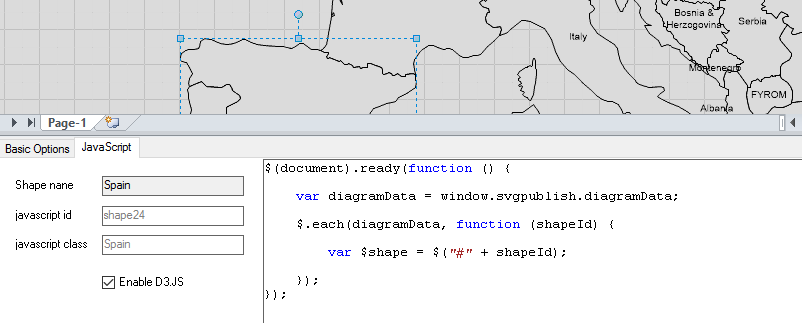
As a second step, let’s switch to "Javascript" tab. There are some edit boxes to set shape custom ids / custom classes, but for this example we won’t be using them; let them be what they are by default. The only thing we are interested in is the code pane. The export addin embeds the javascript code, entered in this pane, into the diagram file itself.
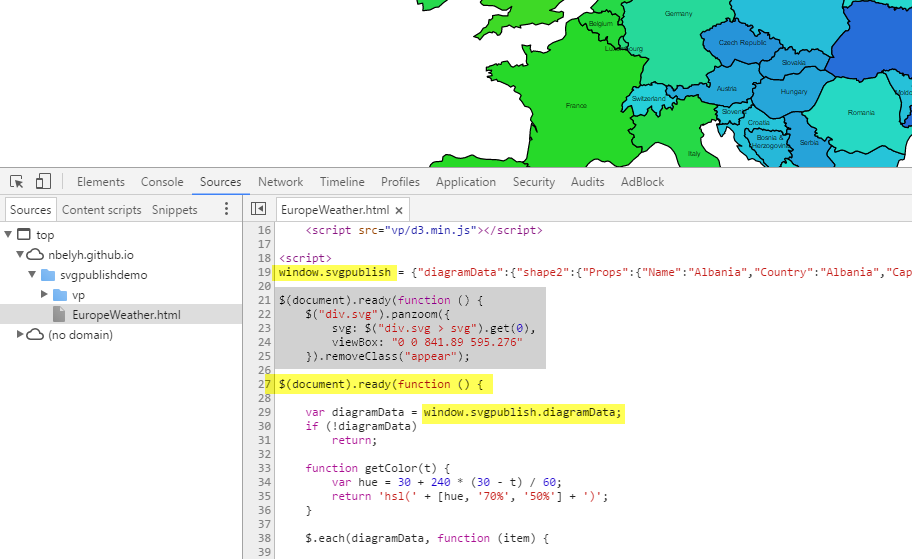
To get the understanding of how that code gets into result page, we can check it directly in the browser, hitting F12. You can see that the addin stores for you all "shape data", and other information (like shape hyperlinks and connection information) in variable "svgpublish". This variable can be used that variable to access the diagram data, but we’ll use it just to enumerate top-level shapes, which are relevant for us.
The code itself is explained below. We iterate over all exported shapes (top-level shapes), get corresponding shape data for each of them (to get capital), then call the weather service, and when we get current temperature from it, paint the shape in corresponding color, and provide a tooltip for it. Good old javascript, no magic at all!
// function to convert temperature in celcius to a color
function getColor(t) {
    var hue = 30 + 240 * (30 - t) / 60;
    return 'hsl(' + [hue, '70%', '50%'] + ')';
}

// for each excported shape
$.each(diagram.shapes, function (shapeid, shape) {

    // get it by id using jQuery
    var $shape = $("#" + shapeid);

    // get shape properties from the exported data
    var props = shape.Props;

    // this is simple hilighting of shape on hover, just set opacity to 0.7
    $shape.on('mouseover', function () { $(this).css('opacity', 0.7); });
    $shape.on('mouseout', function () { $(this).css('opacity', 1); });

    // call the weather service, passing the capital (from shape data) and get the results
    $.get('http://api.openweathermap.org/data/2.5/weather?q=' + props.Capital + '&units=metric&APPID=447ae6275c1ab55c0bc290f632532130', function(data) {

        // set shape color in accordance to the current temperature (data.main.temp is returned from the service)
        $shape.find("path").css("fill", getColor(data.main.temp));

        // build a tooltip (here we use standard bootstrap tooltip)
        $shape.tooltip({
            container: "body",
            html: true,
            title: "" +
                "Country: <b>" + props.Country + "</b></br>" +
                "Capital: <b>" + props.Capital + "</b></br>" +
                "Temperature: <b>" + data.main.temp + "</b>"
        });

    });

});
Hi, I have installed and licenced the most recent version of SvgPublish, but I am struggling with adding JavaScript code to a HTML page. The code is saved correctly in the Visio file, when i close Visio and re-open the file, the JS code shows like before, but when I export to HTML file, the last element is missing from the HTML file.
What could be the cause of this? I have tried to compare my HTML file with the EuropeWeather sample file, but I cannot see any significant difference.
All comments are welcome!